Descending Triangle: Definition and How to Identify

The descending triangle, also known as the ‘falling triangle,’ is a common pattern seen during a trend. Traders expect the market to keep moving in the same direction as the main trend and plan their trades accordingly. They often open a short position when there’s a significant volume drop below the lower trend line of the descending triangle pattern. In this article, we’ll discuss what a descending triangle is, how to identify it, and some FAQs to help you understand it better.
What is a Descending Triangle?
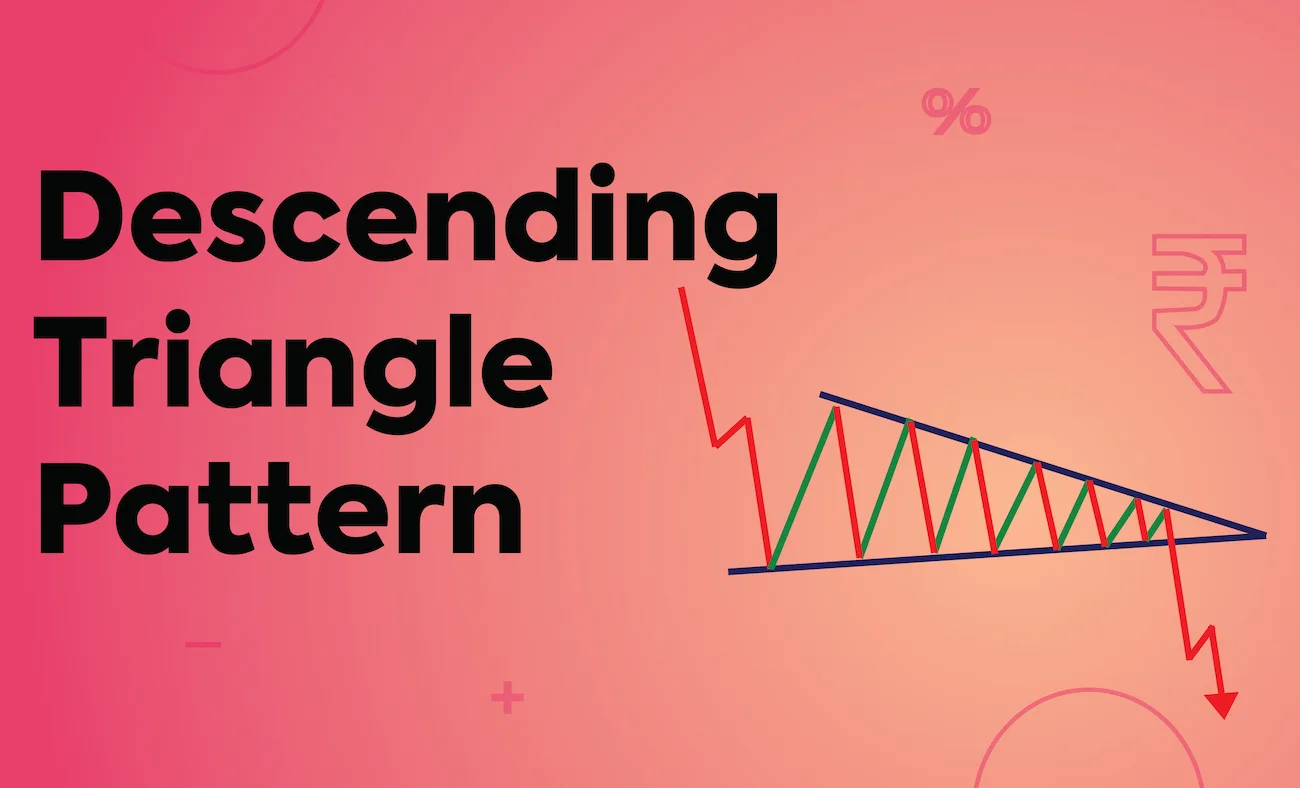
A descending triangle in technical analysis forms when you draw one trend line connecting lower highs and another horizontal trend line connecting lows. Typically seen as a bearish or continuation pattern in a downtrend, it can sometimes signal a bullish reversal if there’s a breakout in the opposite direction.
How to Identify a Descending Triangle
Traders and investors can easily spot descending triangles by looking for specific features. These features apply to both financial and foreign exchange markets.
- Downtrend: First, the market must already be moving downward before the descending triangle forms.
- Consolidation Phase: The descending triangle forms when the market starts to consolidate.
- Descending Upper Trendline: This trendline slopes downward, connecting the highs, showing that sellers are gradually pushing prices lower.
- Horizontal Lower Trendline: Acting as a support, this trendline is horizontal, and prices often approach this level until they break out.
- Continued Downward Trend: This occurs after prices break out below the lower trendline.
Conclusion
The descending triangle is a chart pattern in technical analysis. It typically appears when a downtrend is ending or during a pause in an uptrend. A regular descending triangle often signals a bearish trend continuation. However, it can also be bullish if there’s a breakout in the opposite direction, marking a reversal pattern.
FAQs
What is a Descending Triangle Breakout?
A descending triangle is a pattern that suggests a price might go down. A breakout happens when the price moves above a resistance area or below a support area.
How long does a Descending Triangle Pattern last?
A descending triangle pattern typically forms over about 28 days and generally doesn’t persist for more than 90 days, similar to an ascending triangle pattern. These patterns are commonly seen on daily charts and are usually analyzed over a few months. A strong descending triangle pattern on a daily chart often requires a preceding trend of at least a few months and can develop over several months before a breakout occurs.
What is the difference between Breakdown and Breakout in Technical Analysis?
Breakout means the price moves above a resistance area or below a support area. It shows the price might start trending in that direction. Breakdown is when a security’s price goes down through a support level, indicating possible further declines.
What is the difference between Descending Triangle and Falling Wedge?
A falling wedge appears in a downtrend and signals a likely upward reversal. A descending triangle comes after a bearish trend and suggests a possible continuation of the downward move.
Related Reads:
- Best Timeframes in Forex Trading
- What is Not Gonna Make It (NGMI) Definition in Crypto?
- How to Open a Forex Trading Account?


 Most Visited
  Stock Alert : Intel stocks are down 14.07% in the last 24 hours –