
What is Falling Wedge?
Categories: Guide |
Published by: Rachna Timalsena
02/07/2024

A falling wedge is a chart pattern made by drawing two lines that slope downwards, one showing the highs and the other showing the lows. It is known as a bullish reversal pattern. The line showing the highs slopes down more steeply than the line showing the lows, meaning the highs are dropping faster than the lows. Sometimes, it can also continue the same trend. In this article, we’ll explain the benefits of wedge patterns, the structure of a falling wedge pattern, its importance, and how to trade wedge patterns in Forex.
Benefits of Wedge Patterns
Before we discuss the falling wedge pattern, let’s briefly explore the benefits of wedge patterns. Generally, trading strategies based on price patterns often don’t outperform simply holding investments over time. However, wedge patterns can still be useful for predicting overall price trends.
Wedge patterns narrow down into a smaller price range, allowing for a closer placement of stop-loss orders when entering a trade compared to when the pattern begins. This means that if a trade is successful, the potential profit can be greater than the initial risk taken when entering the trade.
The Structure of a Falling Wedge Pattern
A falling wedge pattern is a chart shape that shows the end of a phase where prices pulled back lower. This pattern can signal both a reversal or continuation of the trend, but both scenarios are generally positive for prices.
Think of the falling wedge as the “calm before the storm.” During this phase, buyers regroup and attract new interest, which helps them overcome sellers and push prices higher.
So, a falling wedge is a key chart pattern indicating that the price pullback has ended. When the price breaks out of the wedge and moves up, it usually means the overall trend will continue.
Importance of the Falling Wedge Pattern
The falling wedge pattern appears when the price of an asset is generally going up, but then corrects and moves lower for a while. During this pullback, two sloping lines are drawn that get closer together over time. The pattern ends when the price breaks above the upper line, which is the wedge’s resistance.
There are three key features of the falling wedge pattern:
- Downward Price Movement: The price temporarily moves down, making lower highs and lower lows.
- Converging Trend Lines: Two lines, one above and one below the price, move closer together.
- Decreasing Volume: The trading volume goes down as the lines converge.
The first two features are essential for identifying a falling wedge pattern. The decreasing volume is also important because it adds credibility to the pattern.
It may take some time to spot a falling wedge that meets all three criteria. To make this easier, you might want to use the latest MetaTrader 5 trading platform.
How to Trade Wedge Chart Patterns in Forex Trading
A Wedge chart pattern forms when two trend lines come together. This shows that the price movement within the pattern is getting smaller. Wedges indicate a break in the current trend.
When you see a Wedge, it means forex traders are unsure about where the pair will go next. A Falling Wedge is a bullish pattern seen in an upward trend, with downward-sloping lines. A Rising Wedge is a bearish pattern in a downward trend, with upward-sloping lines. Wedges can show either a continuation or a reversal of trends.
Rising Wedge
A rising wedge forms when prices move between upward sloping support and resistance lines. The support line is steeper than the resistance line, causing higher lows to form faster than higher highs. This creates a wedge shape in the chart.
When prices consolidate in a rising wedge, a significant move is expected soon, either upwards or downwards. If the rising wedge appears after an uptrend, it often indicates a bearish reversal. Conversely, if it forms during a downtrend, it suggests the downtrend may continue. The key is to be prepared to enter trades when you spot this pattern in forex charts.
In simpler terms, a rising wedge shows that prices are making slower progress in reaching new highs compared to forming higher lows. It typically signals a downtrend, making it a bearish pattern in trading charts.
Falling Wedge
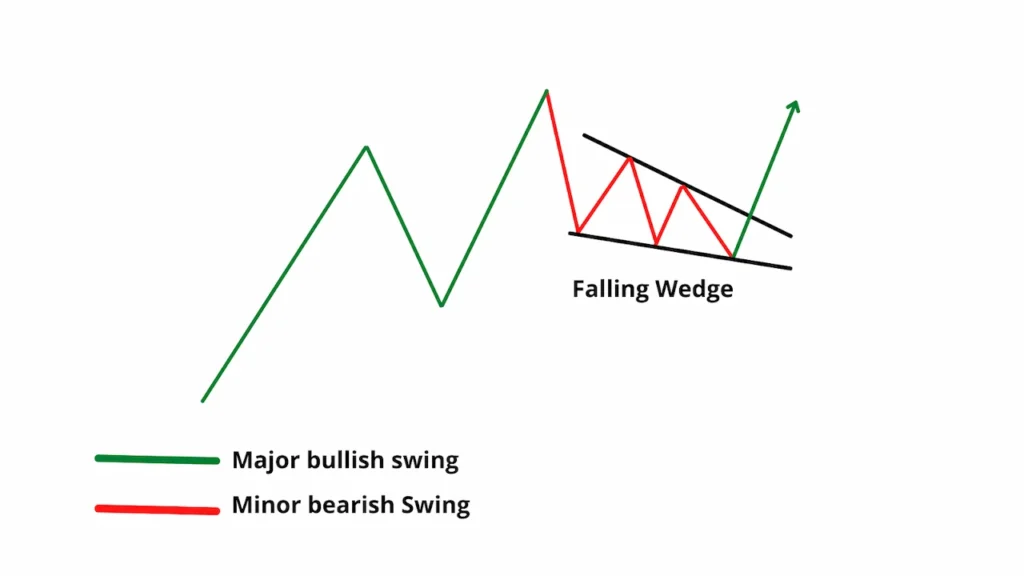
The falling wedge pattern, like the rising wedge, can indicate either a reversal or continuation in price movement. When it signals a reversal, it forms at the bottom of a downtrend, suggesting an upcoming uptrend. As a continuation signal, it appears during an uptrend, indicating that the upward movement will likely continue. Unlike the rising wedge, the falling wedge is considered a bullish pattern.
For example, after a downtrend, the price typically forms lower highs and lower lows. If a falling wedge appears, it often leads to a rally that surpasses previous targets.
Similarly, if a falling wedge forms during an uptrend, it usually means the uptrend will resume later. Traders often place entry orders above the falling trend line that connects the highs of the pattern. This strategy allows them to join the strong uptrend and capture potential gains.
A common approach is to set an upside target based on the height of the wedge formation. Traders may consider locking in profits by closing a portion of their position at the target price, while keeping the rest open to ride further price increases.
Bottom Line
The falling wedge is useful in reversals as well as continuations whereby it signifies a consolidation that may lead to an upsurge. Among the characteristics of this pattern are declining volumes, converging trend lines and lower highs and lower lows. In Forex trading, traders should look for the pattern and set their entry orders above the trend lines for possible profits. On another note, when a rising wedge forms, it indicates a bearish reversal that will hit soon. Traders who can notice these shapes excel at guessing market behavior.
FAQs
Is a Falling Wedge Pattern Bullish?
A falling wedge pattern shows a bullish signal because it suggests that a decreasing price is slowing down, indicating buyers are stepping in to prevent further decline.
Is a Wedge a Continuation or a Reversal Pattern?
A wedge pattern can be either a continuation or a reversal. It depends on which way the wedge breaks out. For instance, a rising wedge after an uptrend often leads to a reversal. Conversely, a rising wedge during a downtrend typically means the downtrend will continue.
Is a Rising Wedge Pattern Bullish or Bearish?
Usually, a rising wedge pattern is bearish. It suggests that a stock which has been rising is likely to reverse its trend and decline soon.
Also read:
- What is SMC (Smart Money Concepts) Forex Strategy?
- What is Not Gonna Make It (NGMI) Definition in Crypto?