- Forex Brokers
Best Brokers
- Guide
- Education
- Forex Software
- Tools
- News

- Forex Brokers
Best Brokers
- Guide
- Education
- Forex Software
- Tools
- News

Heikin Ashi charts are becoming a revolutionary instrument for market analysis in the fast-paced world of financial trading. This Japanese approach, which translates as “average bar,” gives traders a distinct perspective from which to monitor price fluctuations and more clearly recognize trends.
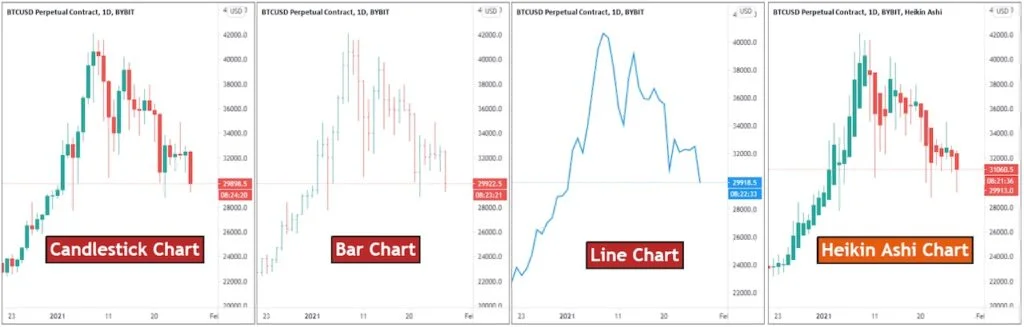
Heikin Ashi charts differ from traditional candlestick charts in their calculation method. They use a modified formula for opening and closing prices, resulting in a smoother representation of price action. This smoothing effect helps traders more easily spot trends and potential reversals.
The four key components of a Heikin Ashi candle are:
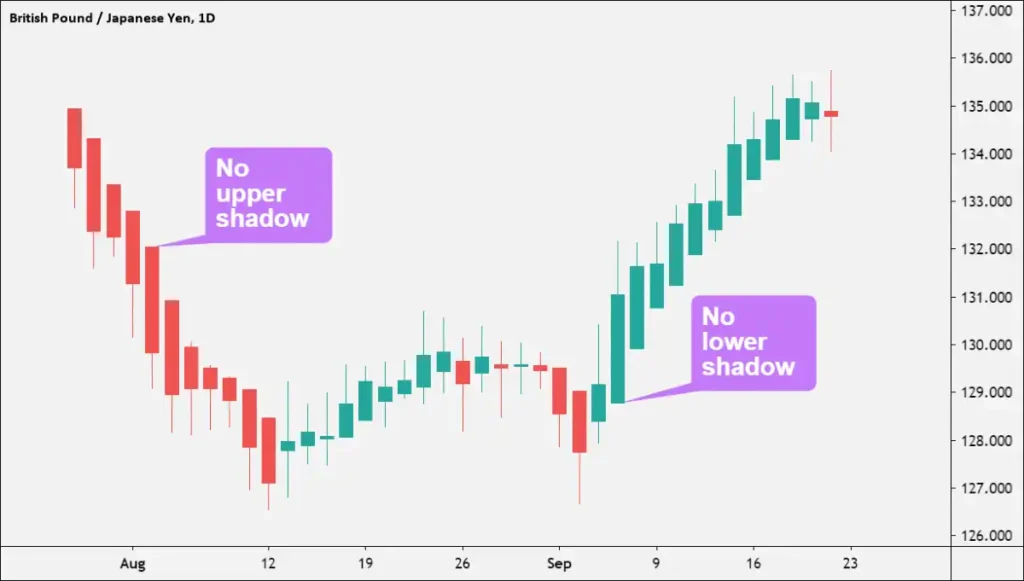
These calculations create candlesticks that appear more uniform and provide clearer trend direction indicators. White or green candles without lower shadows suggest a strong uptrend, while black or red candles without upper shadows indicate a strong downtrend.
Heikin Ashi charts excel at highlighting potential trend reversals. Traders look for small bodies with upper and lower shadows after a series of strong trend candles, often signaling a possible change in direction.
These charts are versatile and can be used for:
The ability to filter out market noise and provide a clearer picture of overall trends makes Heikin charts invaluable for making trading decisions. They offer a unique perspective that can complement traditional analysis methods.
While these charts offer numerous benefits, they’re not without limitations. The modified price calculations can introduce a slight lag in price representation, which may not suit all trading strategies.
For precise price levels, particularly important support and resistance levels, it’s advisable to cross-reference Heikin charts with traditional candlestick charts. This approach ensures a more comprehensive analysis.
To effectively use Heikin charts:
Most modern charting platforms now offer Heikin Ashi as an option alongside traditional chart types. As markets become increasingly complex, this Japanese-inspired technique provides traders with a valuable tool to gain deeper market insights.
Enhancing pattern detection and making trend identification easier are the main objectives of utilizing Heikin charts. In comparison to more conventional charting techniques, they provide a novel viewpoint on market movements and possible possibilities.
Heikin charts may be a valuable tool in any trader’s analytical toolbox with skill and understanding. They give traders a special method to see price activity, enabling them to make better judgments in a range of market circumstances.
Methods like Heikin Ashi charting show how technical analysis is still evolving even as the trading environment does. These charts enable traders to hone their tactics and maybe enhance their trading results by providing an alternative perspective on market dynamics.
Also read: What is ICT in Trading?