- Forex Brokers
Best Brokers
- Guide
- Education
- Forex Software
- Tools
- News

- Forex Brokers
Best Brokers
- Guide
- Education
- Forex Software
- Tools
- News

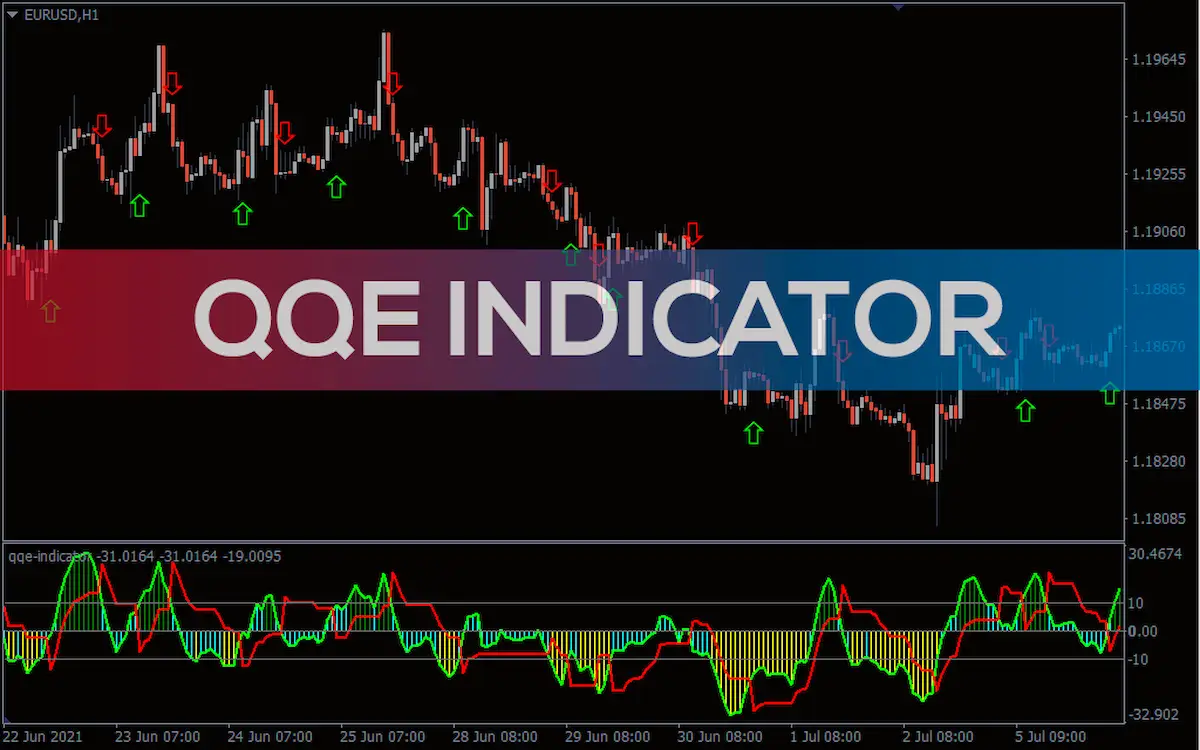
The QQE Indicator is a mysterious indicator. It sometimes appears in trading forums. The fact that makes it even more mysterious is that it is not a well-known indicator. Therefore, many wonder if it deserves a place alongside traditional momentum indicators like the RSI and CCI. Thus, it becomes essential to investigate this mysterious element in detail.
Highlights:
The Quantitative Qualitative Estimation (QQE) indicator is an advanced tool based on Wilder’s well-known Relative Strength Index (RSI). Essentially, the QQE takes the RSI and applies additional smoothing techniques to it. This results in a more refined and stable version of the original RSI. This heavy smoothing process helps to filter out market noise and provides clearer signals for traders. By doing so, the QQE offers a more reliable assessment of market momentum and trend strength compared to the standard RSI.
In addition to its core smoothing function, the QQE often incorporates elements such as signal lines and qualitative assessments. These additions further enhance its ability to identify potential buy and sell opportunities, making it a valuable tool for traders seeking to improve their market analysis and decision-making processes.
The QQE has a complex task to perform. Therefore, it is apparent that it will have a number of functional components to perform various tasks. Its essential components are:
This aspect involves the numerical and statistical analysis of historical price data. The QQE uses the Relative Strength Index (RSI) as a base for its calculations. It then applies a smoothing technique, often a moving average, to the RSI to reduce market noise and provide clearer signals.
This component involves interpreting the smoothed data to make trading decisions. The QQE attempts to identify the quality and strength of a trend, helping traders understand whether the trend is strong, weak, or likely to reverse.
The QQE calculator often includes signal lines, which are derived from the smoothed RSI. These lines help identify buy and sell signals. When the QQE line crosses above the signal line, it may indicate a buying opportunity. Conversely, when it crosses below the signal line, it may suggest a sell opportunity.

To calculate using the default indicator values, first, it is important to calculate the 14-period RSI. Then, it is required to smoothen the RSI by taking the 5-period EMA of the RSI. Next, the users must get the absolute value of the bar-to-bar change in the smoothed RSI. After that, one need to apply a 27-period EMA to these values twice. Finally, one needs to obtain the slow trailing line by multiplying the result by 4.236.
The QQE Indicator has the following uses:
The QQE indicator, occasionally recommended on trading forums, is not widely recognised for its profit potential. Its complexity and the belief that the standard RSI suffices contribute to its obscurity. Despite this, the QQE’s inclusion of extra lines and availability on most trading platforms make it adaptable. However, proper interpretation through training is crucial to avoid potential losses. Its versatility in any market, including Forex, is a significant benefit. Confirming QQE alerts with other indicators enhances trading decisions.