

Trend Lines: How to Draw Trend Lines Correctly
There is a pattern to financial markets. These patterns are analyzed by traders and investors to make informed decisions. When it comes to the most popular visual tool in technical analysis, trend lines are at the top of the list! A trend line is a diagonal line drawn across the price chart. It can link specific price ranges together, providing a relatively clear indication of a security’s trend. Trend lines help measure price momentum and speed in technical analysis. They also apply them to discover prospective help and resistance ranges.
The concept behind trend lines is Dow Theory. This theory was developed by Charles H. Dow, in the late 19th century. He noted that share prices never move headlong in random directions. Prices rather follow discernible trends over a period of time. Analysts started adding only plain lines to paper charts, following these movements. Traders in the past referred to this line as a Dutch line since this type of line originated from Holland.
Trading software nowadays is able to develop automatic trend lines, or enable traders to develop manual ones. These lines are relevant to stocks, indexes, currencies, commodities etc.
Understanding Technical Analysis and Trend Lines
Technical analysis focuses on price movement and volume of trading. Technical analysts do not consider earnings or fundamentals. Instead, they focus on chart patterns and price history. Under the central investing concept that trend is your friend. Identifying market direction is the first step in making a successful trade.
A trend line gives traders a visual indication of the market direction. Market prices always change with supply and demand. A surplus of buyers over sellers drives prices up. Failure to find a balance between buyers and sellers causes prices to decline. Trend lines give a quick look at these changes.
Trend lines also show market psychology. They indicate where buyers continue to enter and sellers continue to come out. These reaction points give traders a clear view on the overall market sentiment when plotted.
The Three Primary Types of Market Trends
A trader must understand the current market set-up before drawing a trend line. The primary ways that markets can go are:
1. Uptrend (Bullish Trend)
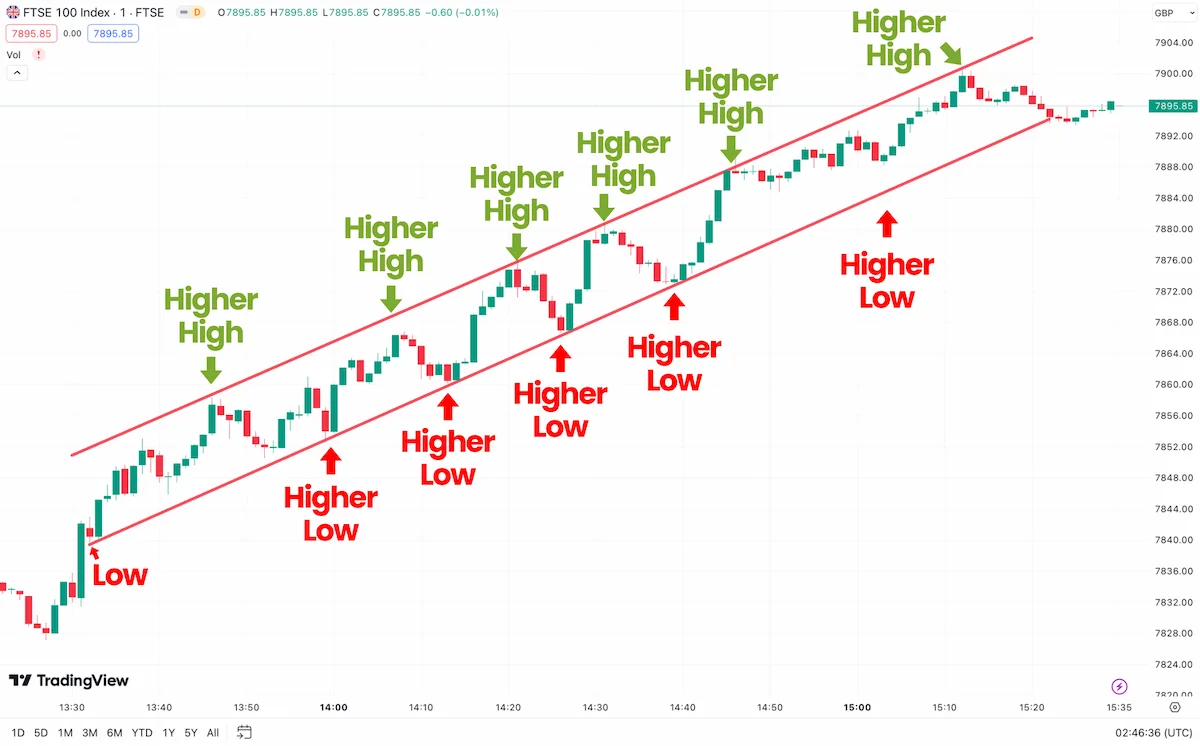
Uptrending occurs when an asset encounters a string of higher highs and higher lows. When it’s an uptrend, the Buyer is in control. With every price decrease, it’s stopping at a higher level than the prior price decrease. These rising lows are connected by an uptrend line.
2. Downtrend (Bearish Trend)
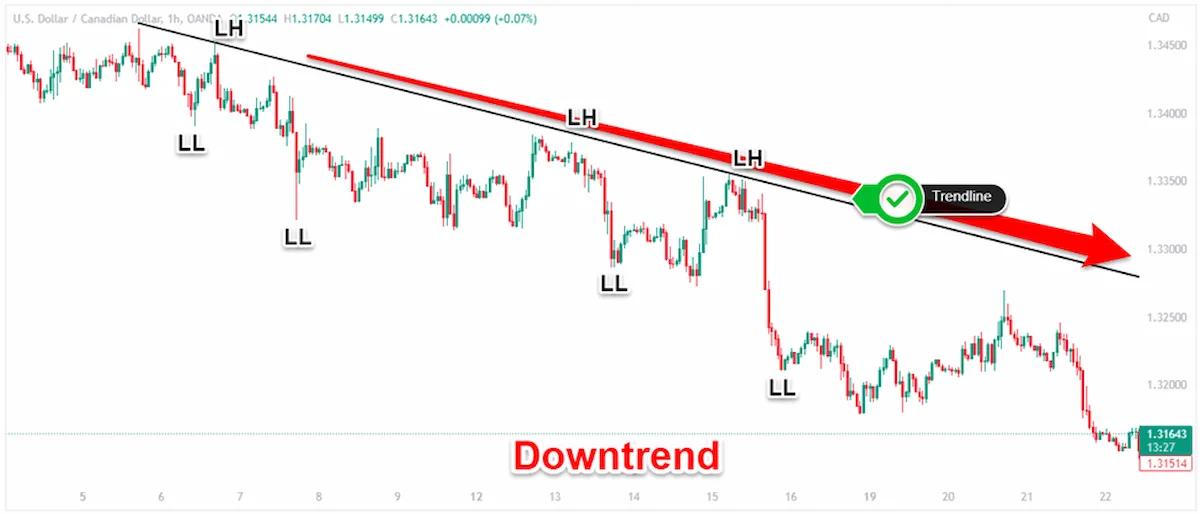
A downtrend is formed when an asset makes lower highs and lower lows. A downtrend is a state of the market where sellers are in charge. Every rally ends lower than the previous. A downtrend line connects these falling highs.
3. Sideways Trend (Ranging Market)
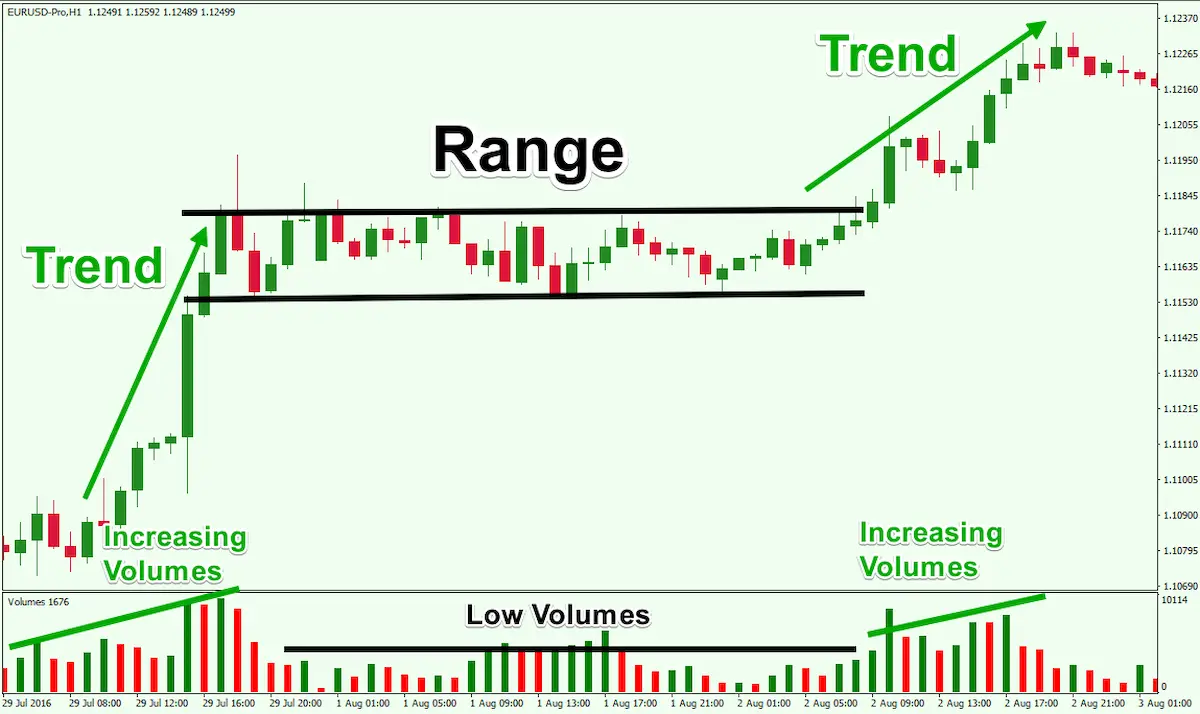
The sideways trend happens if the rate is moving horizontally within a specified range. Buyers and sellers are not long-term dominant. A ranging market is a market that has a consistent pricing level on both its high and low. In this market, traders rely on horizontal lines of support and resistance instead of sloping trend lines.
| Market Trend | Price Pattern | Dominant Force | Line Type |
| Uptrend | Higher Highs & Higher Lows | Buyers (Bulls) | Ascending (Upward Sloping) |
| Downtrend | Lower Highs & Lower Lows | Sellers (Bears) | Descending (Downward Sloping) |
| Sideways Trend | Equal Highs & Equal Lows | Balanced Market | Horizontal Levels |
Types of Trend Lines Used in Chart Analysis
Using various mathematical models in the form of trend lines on price charts. The one selected is based on the underlying asset, the time period and price range.
Linear Trend Lines
A linear trend line is a straight line that charts the trend of data points. It is most effective for assets that increase or decrease at a constant rate over time. Linear scales are great for analyzing shorter time frames.
Logarithmic Trend Lines
A logarithmic trend line represents percentage changes instead of dollar changes. Long term charts can provide a broad spectrum view of prices over a number of years and decades. The benefit of logarithmic scaling is that price spikes do not affect the chart view. Logarithmic trendlines are better for long term investors.
Advanced Mathematical Trend Lines
Polynomial, power, exponential and moving average trend lines can be calculated by chart software. The shape of these lines is curve-linear and fits more complicated price behaviors. These lines are used for quantitative traders for studying high volatility assets.
How to Draw Trend Lines Correctly Step by Step
Trend lines are easy to draw in theory and they can take a bit of practice to use properly. Many traders suffer from the problem in which they try to force lines on a chart. Use these tips to create valid and reliable trend lines:
Step 1: Identify the Dominant Trend
For a larger scale price picture, zoom out on the chart. Determine if the asset is making higher lows, lower highs, or moving sideways. Always trade towards the dominant trend.
Step 2: Locate Significant Pivot Points
Find major swing highs or swing lows on the chart. Pay attention to graphically detected sharp turning points indicating price action reversals.
- On an uptrend, look for the major valleys (swing lows).
- In a downtrend, look for the large peaks (swing highs).
Step 3: Connect at Least Two Pivot Points
Use a straight-line connection between two key price levels.
- When the trend is up, draw the line below the price action on the swing lows.
- If it is downtrend, draw the line on top of price action, which crosses swing highs.
Two points establish a tentative trend line.
Step 4: Confirm with a Third Point
A line connecting two points is only a potential trend line. You must touch it for a third time for a trend line to be considered. It is confirmed by the market when price returns to the line for the third time and bounces.
Step 5: Extend the Line into the Future
Extend the trend line to the right side of the chart. This long line indicates price levels that could form a support or resistance down the road.
Step 6: Do Not Force the Line
Do not overfit a line to the price action. If the line crosses important price layers or necessitates a difficult adjustment, the trend line is not valid. Let the line follow the price action.
Line Charts vs. Candlestick Charts: Where to Draw the Line
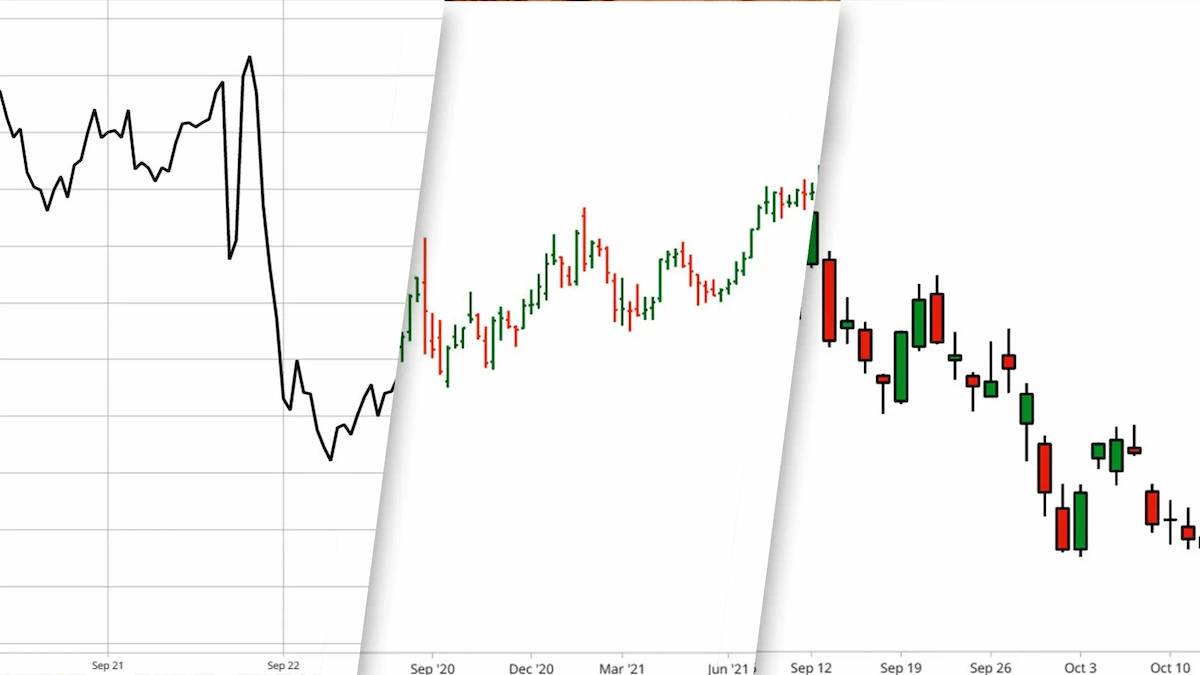
One debate that traders enter in when attempting trend lines is whether they should draw them on the candlestick bodies or the wicks. It depends on what type of chart and what type of trading.
Line Charts
Line charts only plot the closing levels for every time session. In line charts, important closing price positions are joined with trend lines. Line charts filter intraday noise and price extremes.
Candlestick Charts
Candlestick charts show four price points per session: Open, High, Low, and Close. Careful decision making is needed when drawing the trend lines on the candlestick charts:
- Candlestick Wicks: Wicks indicate the session’s all-time high and low points. When traders see the wick tips, many begin to link them since they showcase genuine price rejection levels.
- Using Candlestick Bodies: Some traders connect the open or close levels (the candle bodies). They dismiss long wicks that are a result of short news events or low market integration.
Consistency is the key rule. Never change to other wicks or bodies along the same line. Choose one and use it consistently throughout the chart.
Core Practical Functions of Trend Lines in Technical Analysis
For technical traders, there are several uses of trend lines:
1. Dynamic Support and Resistance
Traditional support levels and resistance lines are horizontal lines. Trend lines are dynamic levels of support and resistance that are moving over time. During an uptrend, the uptrend line would serve as dynamic support. The downtrend dynamic slope is resistance when in a downtrend.
2. Identifying Better Entry Points
Traders use trend lines to grab a position at the best price. In an uptrend, traders can enter near the bottom of a pullback by buying near the support trend line. This entry enhances the possible risk-reward proportions of a trade.
3. Spotting Trend Reversals and Weakening Momentum
Trend lines represent a change in market momentum when price crosses and invalidates them. When price drops below an uptrend line, the bulls are losing control. When prices trade above a downtrend line, sellers are losing their control of the situation.
4. Confirming Trend Strength
The slope and durability of a trend line show trend strength. A trend line that multiple times does not get broken is just an indicator that the market takes trends seriously.
Effective Trading Strategies Using Trend Lines
There are several structured approaches that traders use around trend lines:
Strategy 1: The Trend Line Bounce (Continuation Trade)
This strategy aims to trade towards the dominant trend.
- Find an established trend line that has at least three touches.
- Be patient and wait for the price to return to the trend line.
- Don’t miss the confirmation signal close to the line which can be the bullish reversal candlestick pattern or the growth in volume.
- Get into the trade when price touches the line and bounces back into the main trend direction.
Strategy 2: The Trend Line Breakout
The breakout occurs when price clearly crosses an existing trend line.
- Find a proven down trend line.
- Watch for prices to push above the downtrend line with high trading volume.
- Don’t trade until the candle has closed outside the trend line to avoid false breakouts.
- The trend might now turn bull and traders should consider buying a long position.
Strategy 3: The Breakout and Retest Strategy
Breaking levels is a common sign of minor price pullbacks. This approach for dealing with the risk of false breakouts.
- Find an obvious trend line breakout.
- Avoid going straight on the first break.
- Wait for the price to return and test the broken trend line from the opposite side.
- A breakout above an old resistance level makes an old resistance level a new support level. Enter the trade once price successfully retests and bounces off the line.
Trend Lines vs. Trend Channels
Single trend lines are often combined with parallel ones to create trend channels.
One trend line represents one boundary of the market. The trend channel is made up of:
- The Main Trend Line: Acts as the primary support in an uptrend or resistance in a downtrend.
- The Channel Line: Drawn parallel to the main trend line across the opposite swing points.
This space within two parallel lines forms a Price Corridor. Traders purchase when the price is trading around the bottom of the channel line and sell or take profit near the upper line of the channel. If the break is outside the channel, it is a strong market acceleration and a probable trend reversal.
| Feature | Single Trend Line | Trend Channel |
| Line Count | One diagonal line | Two parallel diagonal lines |
| Purpose | Shows main direction and key support/resistance | Defines the full price operating range |
| Strategy Focus | Bounce entries and breakout reversals | Range trading between upper and lower boundaries |
Combining Trend Lines with Technical Indicators
Looking at the moving averages alone can make one risk running the risk of reading them wrongly. Trend lines and technical indicators create more successful trades.
1. Volume Analysis
If the breakout is confirmed by volume, it is a good one. High trading volume with a trend line breakout shows high participation from institutions. Often, a breakout trading idea on low volume loses momentum and reverses.
2. Moving Averages
Raw price data are adjusted with moving averages. If the trend line lies along with the 50 or 200 day moving average, the support or resistance level is doubled.
3. Relative Strength Index (RSI)
The RSI is a price momentum indicator. When price nears an uptrend support line and RSI creates an oversold reading, the chances of a bull-market bounce are higher.
4. Moving Average Convergence Divergence (MACD)
MACD points out modification in momentum strength. MACD bullish crossover with price touching uptrend line is a powerful entry signal.
Timeframe Selection and Market Context
Trend lines are general purpose tools. They work on any time frame and any asset.
Short Term Timeframes (Intraday Trading)
Day traders predominantly rely on 1 minute, 5 minute and 15 minute charts. Trend lines created on shorter time frames tend to break and form much faster. React to changes in volume and deal with market noise. These lines need to be adjusted regularly by traders.
Higher Timeframes (Swing and Position Trading)
Swing traders and investors use daily, weekly, and monthly charts. The higher the timeframe the more weight a trend line has. They are a reflection of a consensus in the larger marketplace and evolve over time.
Multi-Timeframe Strategy
Trading at multiple timeframes is the best trading practice. First, plot the daily main trend line of the chart to see the overall market trend. Now switch to an hourly chart to draw clear short term Trend Lines and then time your entries accordingly. Always deal with the trend line of the higher time frame.
Risk Management with Trend Lines
When trend lines change abruptly, trading capital can be safeguarded by proper risk management.
Placing Stop-Loss Orders
Trend lines provide logical areas to place stop orders:
- For Long Positions: Set the stop loss order just below the uptrend line or place the stop loss order below the recent swing low. Once price moves below the line, the trade set-up will no longer be valid.
- For Short Positions: Set the stop loss level just above the downtrend line or above the recent swing high.
Usefule guide: Types of Forex Orders: The Ultimate Beginner-to-Pro Guide
Setting Profit Targets
Plan for profits at structurally set levels up in advance. Identify past swing highs, horizontal stems of resistance or trend channel top line. Clear goals do not allow emotional trading decisions.
Limitations and Common Pitfalls of Trend Lines
While trend lines are useful, traders must understand their limitations:
1. Subjectivity
Various types of traders can trend lines on the same chart, but they will be plotted differently. A trader may link wicks and another trader may tie candle bodies. This means the signals traders receive can vary by investor.
2. False Breakouts (Wicks and Traps)
Price often registers a one-time blip above a trend line before going back into the trend. Investors rushing into a deal without waiting for confirmation may fall into market traps.
3. Steep Line Instability
The faster the price surges are, the steeper the trend lines. As the trend line rises or falls, over time it is less reliable. That will create some steep lines, which can’t keep going for long until prices turn around.
4. Sensitivity to News Events
This happens when there are big news updates, important economic data, and earnings reports. A good trend line can be instantly violated on a piece of unexpected news, regardless of technical setup.
Key Best Practices to Remember
It is important to follow these key rules to gain the maximum from trend lines:
- It takes two points to draw a trend line, but three points to confirm it.
- Never force lines to fit into the market chart.
- Steeper trendlines fail faster and are less reliable.
- To understand large market bias, use higher timeframes.
- Always wait for breakout confirmation before taking a trade position.
- Combine trend lines with volume and secondary technical indicators.
Conclusion
Trend lines are easy yet powerful indicators that show market direction, dynamic support and market resistance. If the lines are accurately plotted on the recognized price points, they help to recognize the high probability entry and exit opportunities. To trade effectively, always avoid forcing lines onto the chart, manage your risk, and combine trend lines with other technical indicators for confirmation.
FAQs
How many points do you need to draw a valid trend line?
To draw a line on a chart, you must use at least two pivot points. But, the trendline needs a third point on the line for the trend line to confirm.
What is the main difference between a trend line and a channel?
Trend Line is a single line identified as a support or resistance. Channels are actually two parallel trend lines that show both the upper resistance and the lower support level at the same time.
Should I draw trend lines using candlestick bodies or wicks?
Both methods are acceptable. Bodies target closing prices and filter out short spikes, wicks hit highpoints and lowpoints. Choose one style and apply it throughout the charts.
What does a steep trend line indicate?
A very steep trend line means a strong price trend. But, rising trendlines are less accurate and have a short life as markets are unable to maintain high degrees of speed for long periods of time.
Why do trend lines break?
When market momentum changes and the opposite camp takes control, trendlines break. Prices break out of trend lines when fundamental news events, profit taking, or changes in supply and demand occur.
Also read: Choosing a Reliable Forex Broker