

Trend Channels
Market prices never go in a straight line. They travel in waves, forming peaks and troughs as buyers and sellers battle for control. If you look closely at any price chart, you will see that these zigzags often follow a clear path.
Technical analysts use a simple and reliable tool to map these paths: trend channels.
Trend channels gives you a visual guideline of the trading price. It will help you recognize the home prices are likely to bounce, pause and make a break into a new move.
This is a complete guide to trend channels: what they are, various types, how to draw your own, how to trade using them, risk management, and pitfalls to avoid.
1. What is a Trading Channel?
A trading channel is a chart pattern in technical analysis formed by two parallel trend lines that indicate the support and resistance levels of an asset.
- The lower trendline serves as a support level, where buyers start buying again and again.
- The upper trendline line serves as resistance, where sellers may capitalize on the trend and open short trades.
The ongoing market respects the channel till price remains there. The moment you draw a trading channel on your chart, you are transforming your raw price action of your chart into a usable roadmap.
How Trading Channels Work in the Market
The phenomenon of price trading in a channel is the result of shared psychological expectations in the marketplace.
- When the price falls to the lower boundary, traders view the asset as relatively cheap and start buying.
- The more traders see the price increase toward the uptrend, they consider the asset costly and remove theirs or place a sell order.
- This continual vibration forms the channel structure.
Staying in the boundaries are great setups to trade, while a channel breakout locates the largest market moves. Momentum is strong and a price move occurs when price decisively breaks out of the channel.
2. Types of Trading Channels: Trend Channels vs. Envelope Channels
Technical analysts categorize trading channels into two main categories: Trend Channels and Envelope Channels.
Trend Channels (Slope-Based Channels)
Trend Channels are straight and angled trendlines that are plotted directly through swing highs and swing lows. These determine the existing market trend and force.
Trend channels represent market trend cycles that typically have three phases:
- Breakout Gaps: A gap that begins the new trend.
- Runaway Gaps: When one trend quickly is moving inside the channel.
- Exhaustion Gaps: The last move towards a channel breach or reversal.
Trend Channels are lines and hence they don’t curve and adjust automatically if the market turns. These need to be updated and redrawn with new price action.
Envelope Channels (Statistical and Indicator-Based Channels)
Envelopes are mathematical calculations and formulas that wrap around price action. They self-regulate based on market fluctuations.
The two most frequently used envelope channels are:
- Bollinger Bands: Bollinger Bands are based on the two statistical bands around a central moving average. The upper level is 2 standard deviations above the moving average and the lower level is 2 standard deviations below. The bands become wider during a period of high volatility and narrower during low volatility.
- Donchian Channels: Donchian Channels plot the highest high and the lowest low over a set number of periods (usually 20 days). The top line indicates the highest price for the period and the bottom line indicates the lowest price for the period.
3. The Three Core Trend Channel Formations
Trend channels come in three main variations based on their slope:
| Channel Type | Slope | Price Pattern Structure | Market Sentiment |
| Ascending Channel | Upward (Positive) | Higher Highs and Higher Lows | Bullish |
| Descending Channel | Downward (Negative) | Lower Highs and Lower Lows | Bearish |
| Horizontal Channel | Flat (Zero Slope) | Equal Highs and Equal Lows | Neutral / Ranging |
Ascending Channel (Bullish Trend Channel)
An ascending channel forms when the price makes a steady series of higher highs and higher lows.
- Structure: Tie lows together and highs together and have the support line sloping up. Next, create a parallel line between the upswings to create the resistance line.
- Market Dynamics: Buyers act on all pullback levels.
- Trading Bias: Anticipating a long buy signal will be near the lower support line. If you are a trader, look to take partial profits close to the top resistance rail.
Descending Channel (Bearish Trend Channel)
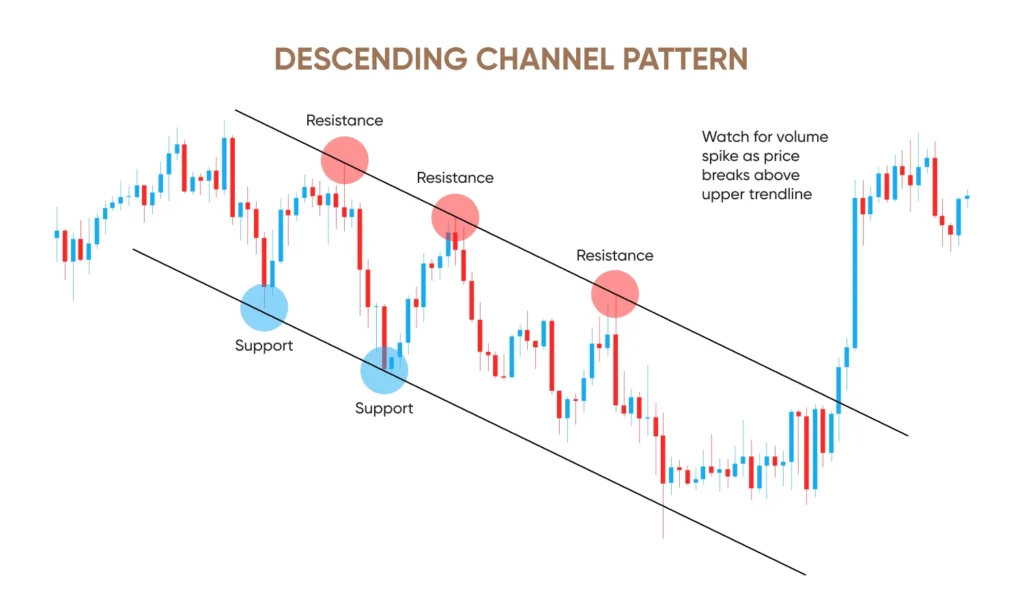
A descending channel is made up of price forming a consistent pattern of lower highs and lower lows.
- Structure: Down Sloping Resistance Line: Link the falling highs with a downward sloping resistance line. Next, draw a parallel line to the tops which connect the falling lows to form the support line.
- Market Dynamics: Sellers are on top of the order book and continue to dump stock at increasingly depressed prices.
- Trading Bias: use the upper resistance line to seek a short selling opportunity. Take profit or cover shorts around the lower force road.
Horizontal Channel (Flat / Sideways Range)
Prices moving between a flat horizontal support and resistance are signals of a horizontal channel.
- Structure: Make horizontal flat lines from swinging high to swinging high and horizontal flat lines from swinging low to swinging low.
- Market Dynamics: There is a relatively stable equilibrium between demand and supply. There isn’t enough volume on either side to support a trend.
- Trading Bias: Buy at the lower support level and sell at the upper resistance level. Be alert for breakout moves which indicate a new trend direction.
4. Why Trend Channels Matter in Technical Analysis
Trend Scalp channels give you an edge over traders who use only one indicator. Here is why they are essential for your trading routine:
Instant Trend Identification
The direction of the market is easily apparent upon a moment’s glance on a channel. When a channel is sloping upward, bulls are in control. If it’s down sloping, then you trade the bear trend. This helps you avoid taking high-risk trades against the main trend.
Built-In Support and Resistance
Channel rails indicate exact areas of dynamic support and resistance, rather than the mere speculations about where the price may stop. The bottom line is where you buy and the top line is where you sell.
Clear Risk-to-Reward Ratios
It is easy to plan trades by channels. Your stop loss would be right below this support line if you are entering a trade around the low rail. The opposite rail is near your profit target. This allows a person to have a great risk to reward ratio per every execution.
Early Reversal and Breakout Warnings
Forming a channel is a sign that the trend is slowing down as it fails to reach the other side of the rail. If the price surpasses the channel limits, it signals potential trend reversals or strong momentum moves.
5. How to Draw Trend Channels Correctly: Step-by-Step
Accurate trend channel drawing takes practice. Many novice traders tend to expect the lines to match the meteors randomly.
Here are the steps to help you create successful channels each time:
Step 1: Start on Higher Timeframes
Start analyzing from a higher time frame, for example the weekly chart or the daily chart. Trading on higher timeframes will smooth out intraday market noise and present the proper underlying trend. After determining the main channel on the daily chart, switch to the hourly or 15-minute chart and look for signals.
Step 2: Identify Clear Swing Highs and Lows
Scan the chart for prominent peaks (swing highs) and valleys (swing lows). Try to stay on top of the major pauses or tight, intraday ranges rather than drawing lines through them. Look for places where the price decidedly reversed.
Step 3: Draw Your Primary Trendline
To construct a valid trendline, draw two or more swing points.
- For an uptrend, draw a line between two major swing low points.
- If it’s a downtrend, join two major swing highs together.
Rule of Thumb: It takes two points to draw a trendline, but it takes three points to confirm that the trend actually exists.
Step 4: Project the Parallel Line
With base trendline now place, draw another parallel trendline of identical slope:
- For an ascending channel, draw the parallel line on the highest peak of the range between the two lows.
- For a descending channel, draw the parallel line on the lowest low point between the two highs.
Step 5: Avoid the Perfection Trap
Real-world market data is messy. Candlestick wicks will occasionally poke slightly outside the channel lines. Never bend lines to capture all the price action waves. Unless they are parallel, you are drawing a triangle or wedge pattern, not a trend channel.
6. How to Perform Channel Width and Slope Analysis
The trend channel’s geometry gives significant hints to market sentiment and volatility.
Analyzing Channel Slope (Speed and Momentum)
- Steep Channels (greater than 45 degrees): A steep channel indicates explosive momentum. But strong upward lines are prone to reversals. Treat steep channels with caution, as sharp corrections often follow.
- Moderate Channels (Around 30 to 45 degrees): These channels are examples of healthy, sustainable trends. The most dependable basis for swing trading is the buying and selling by institutional buyers and sellers, which takes place gradually over time.
- Shallow Channels (Less than 20 degrees): A shallow channel signals weak momentum. Not much is happening, so the market is drifting.
Analyzing Channel Width (Volatility Cycles)
The vertical distance between your support line and resistance line is the channel width. This can help you measure the change of volatilities if you follow this width:
- Spread: As the distance between channel lines increases, so do the price fluctuations. This is an indication of increased volatility and suggests that this trend may be overextended and heading to an exhaustion point.
- Contracting Width: If the channel is constricting, then price action is narrowing. This compression suggests a decrease in volatility, paving the way for an explosive breakout.
7. How to Trade Inside Trend Channels (Bounce Strategy)
Trading channel bounces is one of the best methods when it comes to benefiting from a confirmed trend. The strategy is based on the idea that one should buy low at the support and sell high at the resistance of a channel.
Uptrend Buy Setup:
- Watch as it falls back to the lower support level.
- Confirm rejection (hammer candle, bullish engulfing, oversold RSI).
- Buy at the support line.
- Set Stop Loss just below the recent swing low.
- Set Profit Target at the midline (TP1) and upper rail (TP2).
Trading the Ascending Channel
- Wait for the Retracement: This involves giving the price enough time to move toward the lower trendline support level. Avoid buying when the price is hitting the upper trend line.
- Look for Confirmation: Wait for price action to confirm that the support line is holding. Learn to see bullish reversal candlestick patterns, such as Hammer and Bullish Engulfing candles.
- Enter: Enter a long trade when the confirmation candle closes.
- Use the Channel Midline: This is the intermediate dotted line or the channel average which can be used as support and resistance. Short-term day traders and scalpers can frequently use the midline to take partial profits or add to winning trades.
Trading the Descending Channel
- Wait for the Rally: Wait until it rallies back toward the upper resistance trendline.
- For Confirmation: Watch for bearish reversal patterns like a shooting star or a bearish engulfing right at the upper rail.
- Short Entry: Enter a short position when the price receives rejection from the upper line.
- Manage the Trade: When price is moving lower and getting closer to the channel bottom, sell and give up your position.
8. Trading Breakouts and Avoiding Fakeouts
When a range-bound channel bounces, it creates consistent returns, while breaking out channels present the biggest moves.
Upside Breakouts
Instead, an upside breakout happens when the price pierces the top trendline and settles atop it.
- In an ascending channel, an upside breakout signals trend acceleration. The standard trend angle is unable to stop the buying pressure.
- An upside breakout in a descending channel is a significant bullish channel reversal. The extended bear market is now over, and buyers are in charge.
Downside Breakouts (Breakdowns)
An upside breakout occurs when the price falls below its lower support level and then stays below it after the close.
- With an ascending channel, the downside break is a trend failure. There was no buyer defense of support, setting the stage for a big correction or even a new downtrend.
- Descending channel breakout signals doomed sellers and the acceleration of the trend to the downside.
The Danger of Fakeouts (False Breakouts)
Fakeout happens when the price seems to temporarily move through the channel, and misleading breakout traders only to turn out quickly back into that channel.
How to Protect Yourself from Fakeouts:
- Wait for Candle Closes: Avoid taking trades based on the wick breakout within an open candle. Wait for the candle to definitely close out of the range on the time period you have selected.
- Check Trading Volume: True breakouts require heavy volume. High volume proves institutional money is driving the move. If a breakout is on low volume, odds are it is a fakeout.
- Wait For Break-and-Retest: Trading break out is okay, but the best idea is to wait for retest. Wait for confirmation of the price breakout, then test from the outside, and confirm that old resistance is now new support (or vice versa).
9. Comprehensive Risk Management: Stop Loss and Target Setting
The top approach to trading is a risk management guideline. Here is how to manage stops and profit targets when trading trend channels:
5 Techniques for Setting Stop Losses in Trend Channels
- Below Key Support Levels: For long trades, look for a few points below the channel line of support level and below recent swing lows. This gives leeway for the usual fluctuations in prices.
- Last short schemes: When you go short near the top of the channel, set your stop loss right above the resistance trendline and major tops.
- Trailing Stops Under Swing Lows: Once the price favors, place your trailing Stop under the newly formed swing lows of the channel. This will secure your gains and leave your upside potential open.
- Volatility-Based ATR Stops: Use the Average True Range (ATR) indicator. Place the stop loss 2 to 3 times ATR value below the buy price. This prevents normal market volatility from prematurely stopping you.
- Midline Pullback Stops: When trading a pullback to the channel midline, place your stop below the recent pullback low. Just be sure that your profit level is at least twice your distance of risk.
Setting Logical Take-Profit Targets
Don’t be a blind trader. Use to take profit systematically using the following structured methods:
- Opposite Channel Rail: The ultimate objective of every channel bounce trade is the opposite trendline. When you buy at support, target resistance.
- The Channel Midline: Use the 50% midline of the channel as your first take-profit target (TP1). Lock in partial profits and try to take your stop loss level to breakeven.
- Previous support and resistance levels: Look to the left on your chart for previous major tops, bottoms, historically strong and weak levels, or psychological round numbers.
- Moving Average Alignments: Dynamic averages like the 20-day, 50-day, or 200-day simple moving averages are significant resistance and support zones that prices tend to linger at.
- Scale-Out Strategy: Avoid selling all your positions at once, scale out the plan. Remove 50% of your table amount at the midline, 30% of the table at the other rail, then keep 20% of the table for any large breakout.
10. Combining Trend Channels with Technical Indicators
To boost the reliability of your trend channel setups, combine them with other technical indicators for confluence:
- Relative Strength Index (RSI): If the price touches the support (lower channel line) with RSI below 30 (oversold) and is curling higher, then the chances are very high of a bounce. As the price approaches the upper rail and Rsi is above 70 (overbought), watch for selling pressure.
- Moving Averages: When the ascending channel support line aligns with the 50-day moving average, which is rising, it becomes a high conviction support zone.
- Classic Chart Patterns: Watch for flags, pennants, double bottoms, and head-and-shoulders patterns forming directly inside your channel. For instance, an inverse head-and-shoulders pattern forming at the bottom rail of a descending channel provides an early signal of a bullish reversal breakout.
11. Limitations of Trend Channels
Trend Channels are good but not guaranteed. Keep these limitations in mind:
- Not Effective in Sideways Markets: Trend channels are ineffective when the market is chopping around. They tend to generate false signals in periods of indecision in the price movement.
- Subjectivity: We have to make some judgments to draw trendlines. This is simply because the two traders build their channels on the chart at somewhat different slopes, with varying buy and sell signals.
- Lagging at Sharp Reversals: The point is that trendlines are lines that are straight and static, so they do not predict news-driven spikes and crashes. When the channel line breaks, much of the price move may be done as well.
- Frequent Redrawing Required: Markets are always changing. When the price fluctuates and when new level points are reached, the channel boundaries need to be adjusted and drawn again to make them valid.
Final Thoughts
Trend channels bring clear structure to unpredictable market movements. They paint the picture around price action by using dynamic resistance and support lines to uncover market levels that are likely to be profitable, preserve capital, and can deliver an explosive breakout opportunity.
Always wait for confirmation, pair trend channels with other indicators such as volume and RSI, and tightly risk manage on each trade to maximize trend channel benefits. With patience and discipline, trend channels act as a key map in any market condition.
FAQs
What is the difference between a trendline and a trend channel?
A trendline is a single line that connects either swing highs (resistance) or swing lows (support). A trend channel is two trendlines parallel to one another, a trendline on each side of the price action so that it has both the support trendline and the resistance trendline at a single time.
How many touches are needed to confirm a valid trend channel?
To draw an initial trendline, at least two swing points are required, but three separate touches are necessary to validate the trendline and channel.
What is the difference between an ascending channel and a descending channel?
A bull market is characterised by higher highs and higher lows, which form an ascending channel. A descending channel has lower highs and lower lows and is said to be bearish.
Can trend channels be used for day trading and scalping?
Yes. Trend channels are effective across all time frames, ranging from scalpers with 1-minute and 5-minute charts to swing traders and long-term investors on daily and weekly charts. However, higher timeframe channels carry greater reliability and less market noise.
How do I know if a channel breakout is real or a fakeout?
A true breakout is one that has high levels of movement and traffic volume away from the channel with final inverted close. A trip to the trendline on low volume only to immediately pull back into the trendline. Waiting to close on the candle for a successful break and retest can confirm the breakout.
Where should I place my stop loss when trading a channel bounce?
The ideal stop loss order for a long position is just below the support line and below the latest swing low when entering the lower rail of a channel. If you are going short at the top of the rail, put your stop loss just above the resistance line.
Useful link: The Role of Central Banks in Forex Trading